A guideline
for ResNuc
ResNuc is a software package to
predict the position of nucleosomes and includes a web-based platform and a standalone version. The
web-based version of ResNuc has been developed using the Django web development platform and Keras machine
learning library and consists of four main parts (Figure 1). The
first part comprises two
datasets
associated with the nucleosome positioning information and extracted features. These datasets can be
downloaded and used in computational biology-based projects (Figure 2).
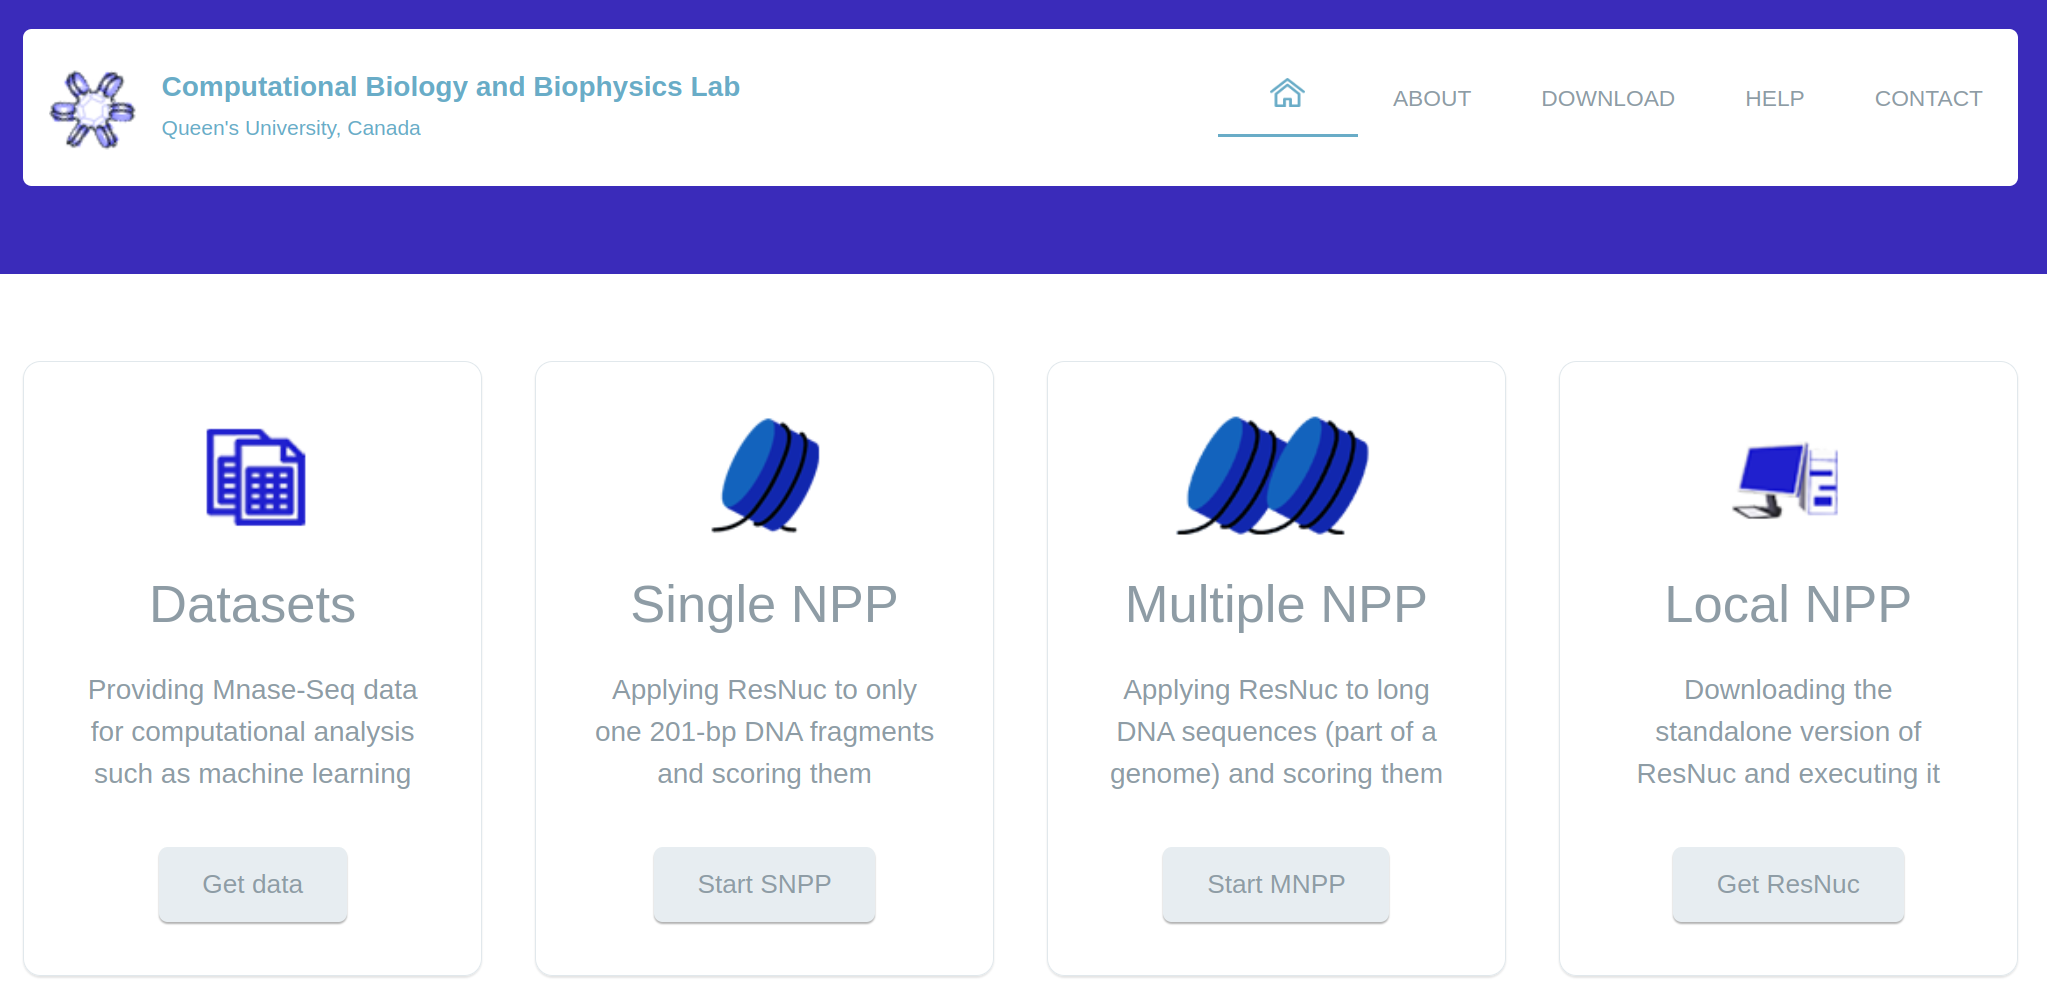
Figure 1: The overall schematic of ResNuc’s web-based platform
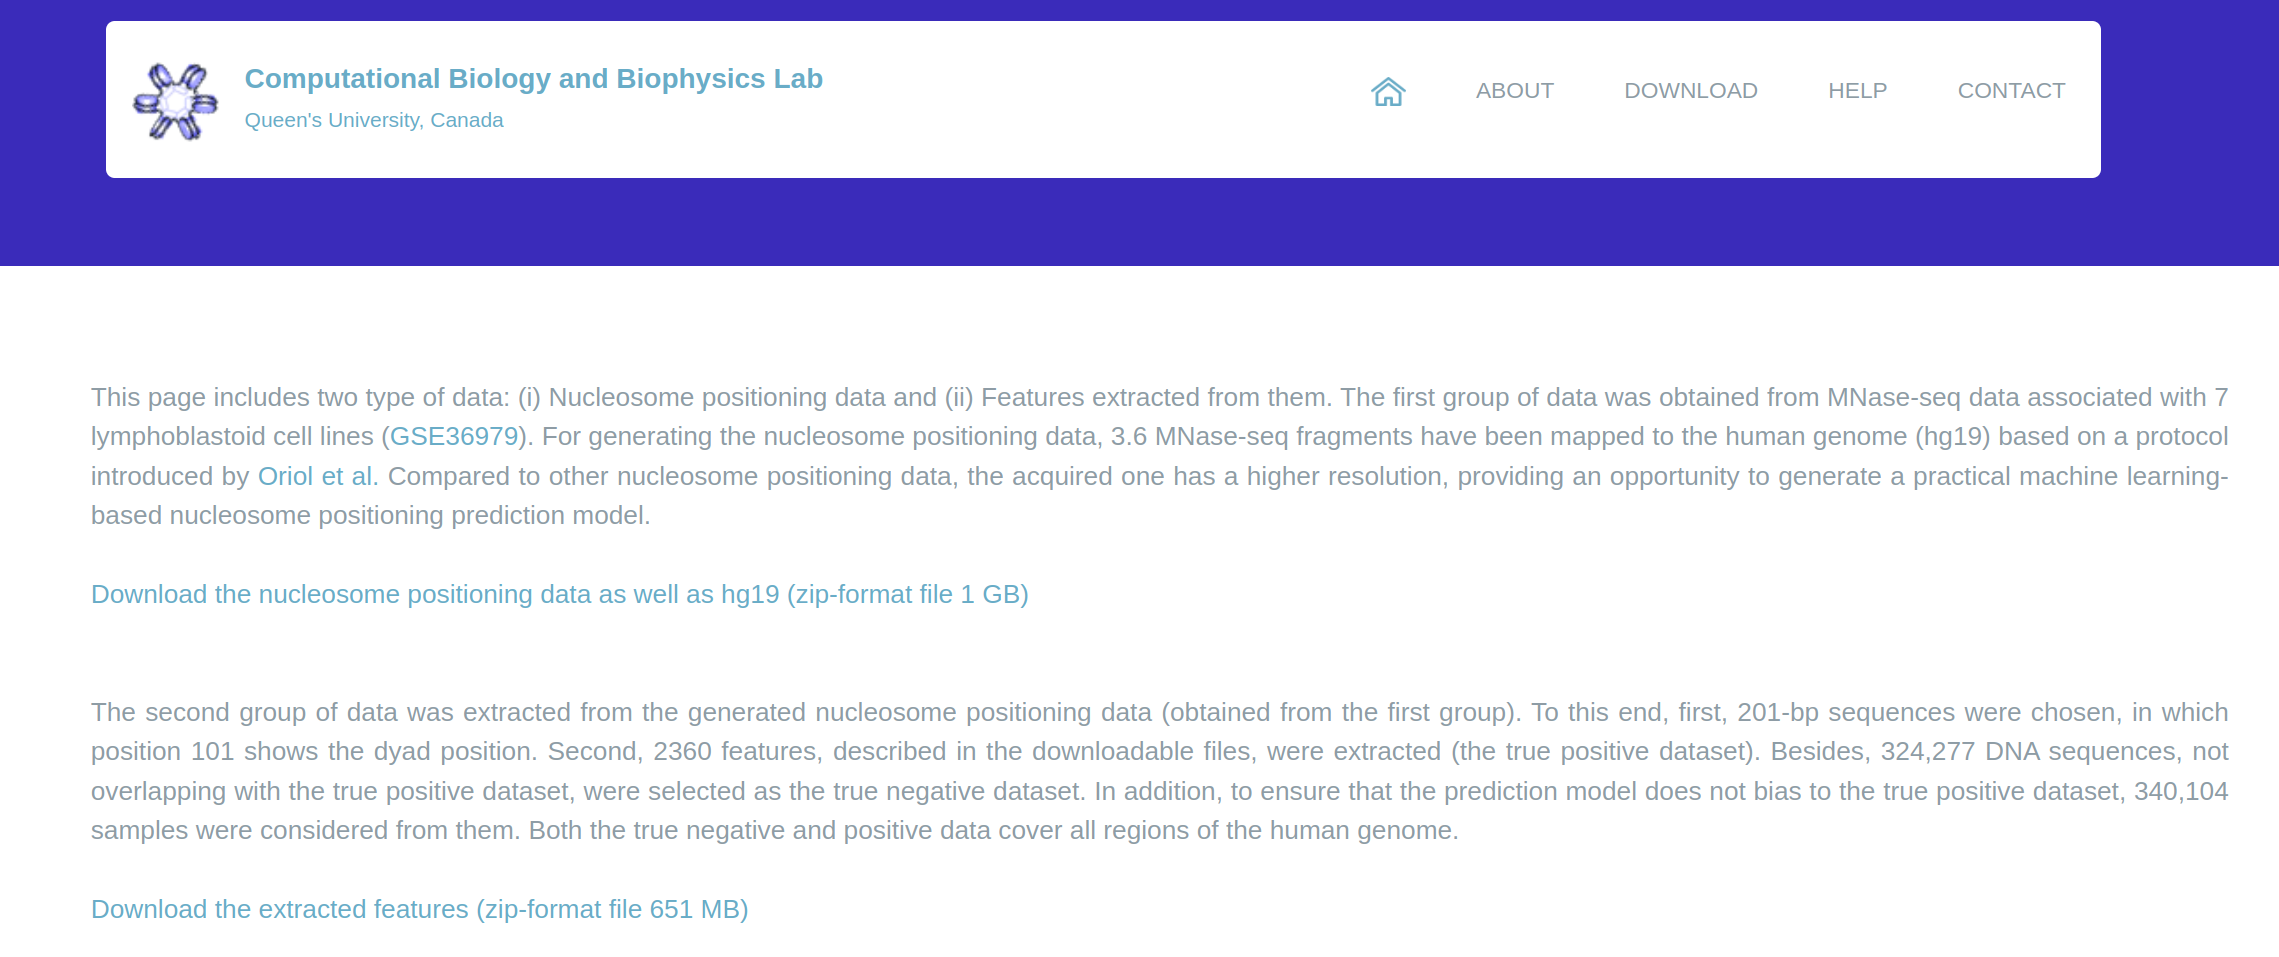
Figure 2: The dataset section of ResNuc’s web-based platform
The second part of the web-based
platform, single nucleosome positioning prediction (
SNPP), receives at most 500 201-bp
DNA sequences
(FASTA format) and predicts their nucleosome positioning capabilities. To this end, the given sequences are
extracted from the input, and, then, their features are extracted. Next, they are passed to the prediction
model and are labeled with a probability value indicating how much a specific DNA sequence can be occupied
by a histone octamer. Although the generated prediction model can be applied to the smaller DNA
fragments, it is advised to use 201-bp DNA fragments. Figure 3 displays the SNPP section of ResNuc.
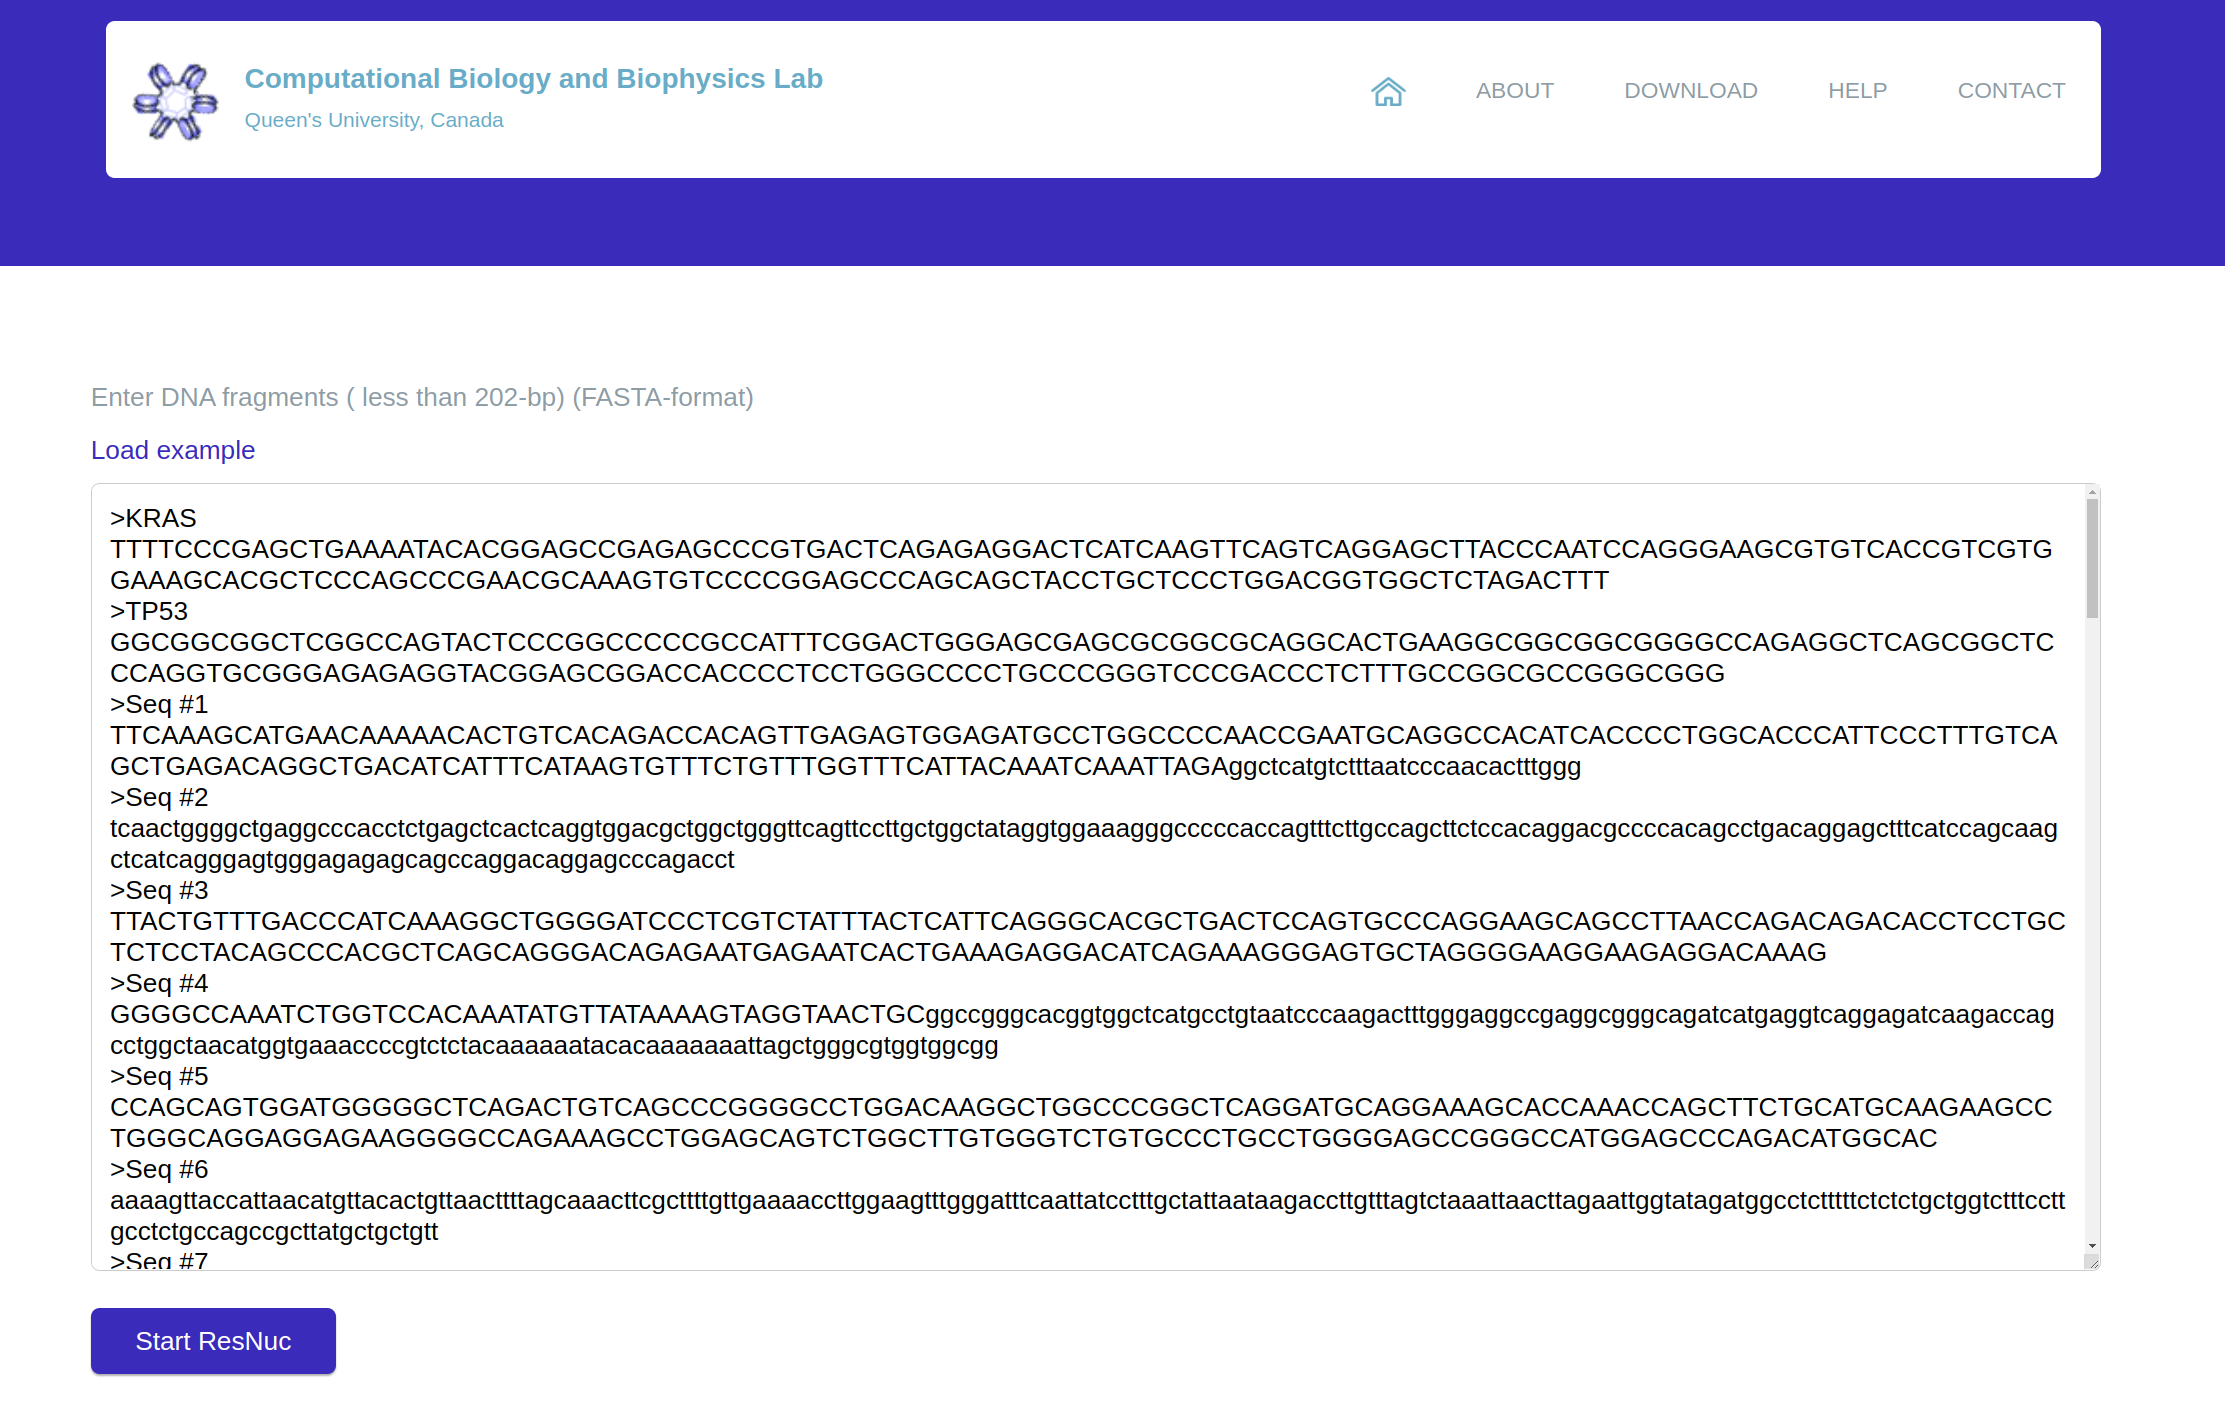
Figure 3: The SNPP section of ResNuc’s web-based platform
The third part of the web-based
platform searches for the position of nucleosomes in a given long-size DNA sequence (
MNPP). For this
purpose, ResNuc divides the sequence into 201-bp fragments and then calls the generated prediction model.
Like SNPP, due to high computational complexity, the web version of MNPP has been limited to 700 bp DNA
sequences. For larger sequences, the
standalone version be utilized. Figure 4 shows the
MNPP part
of the web-based platform.
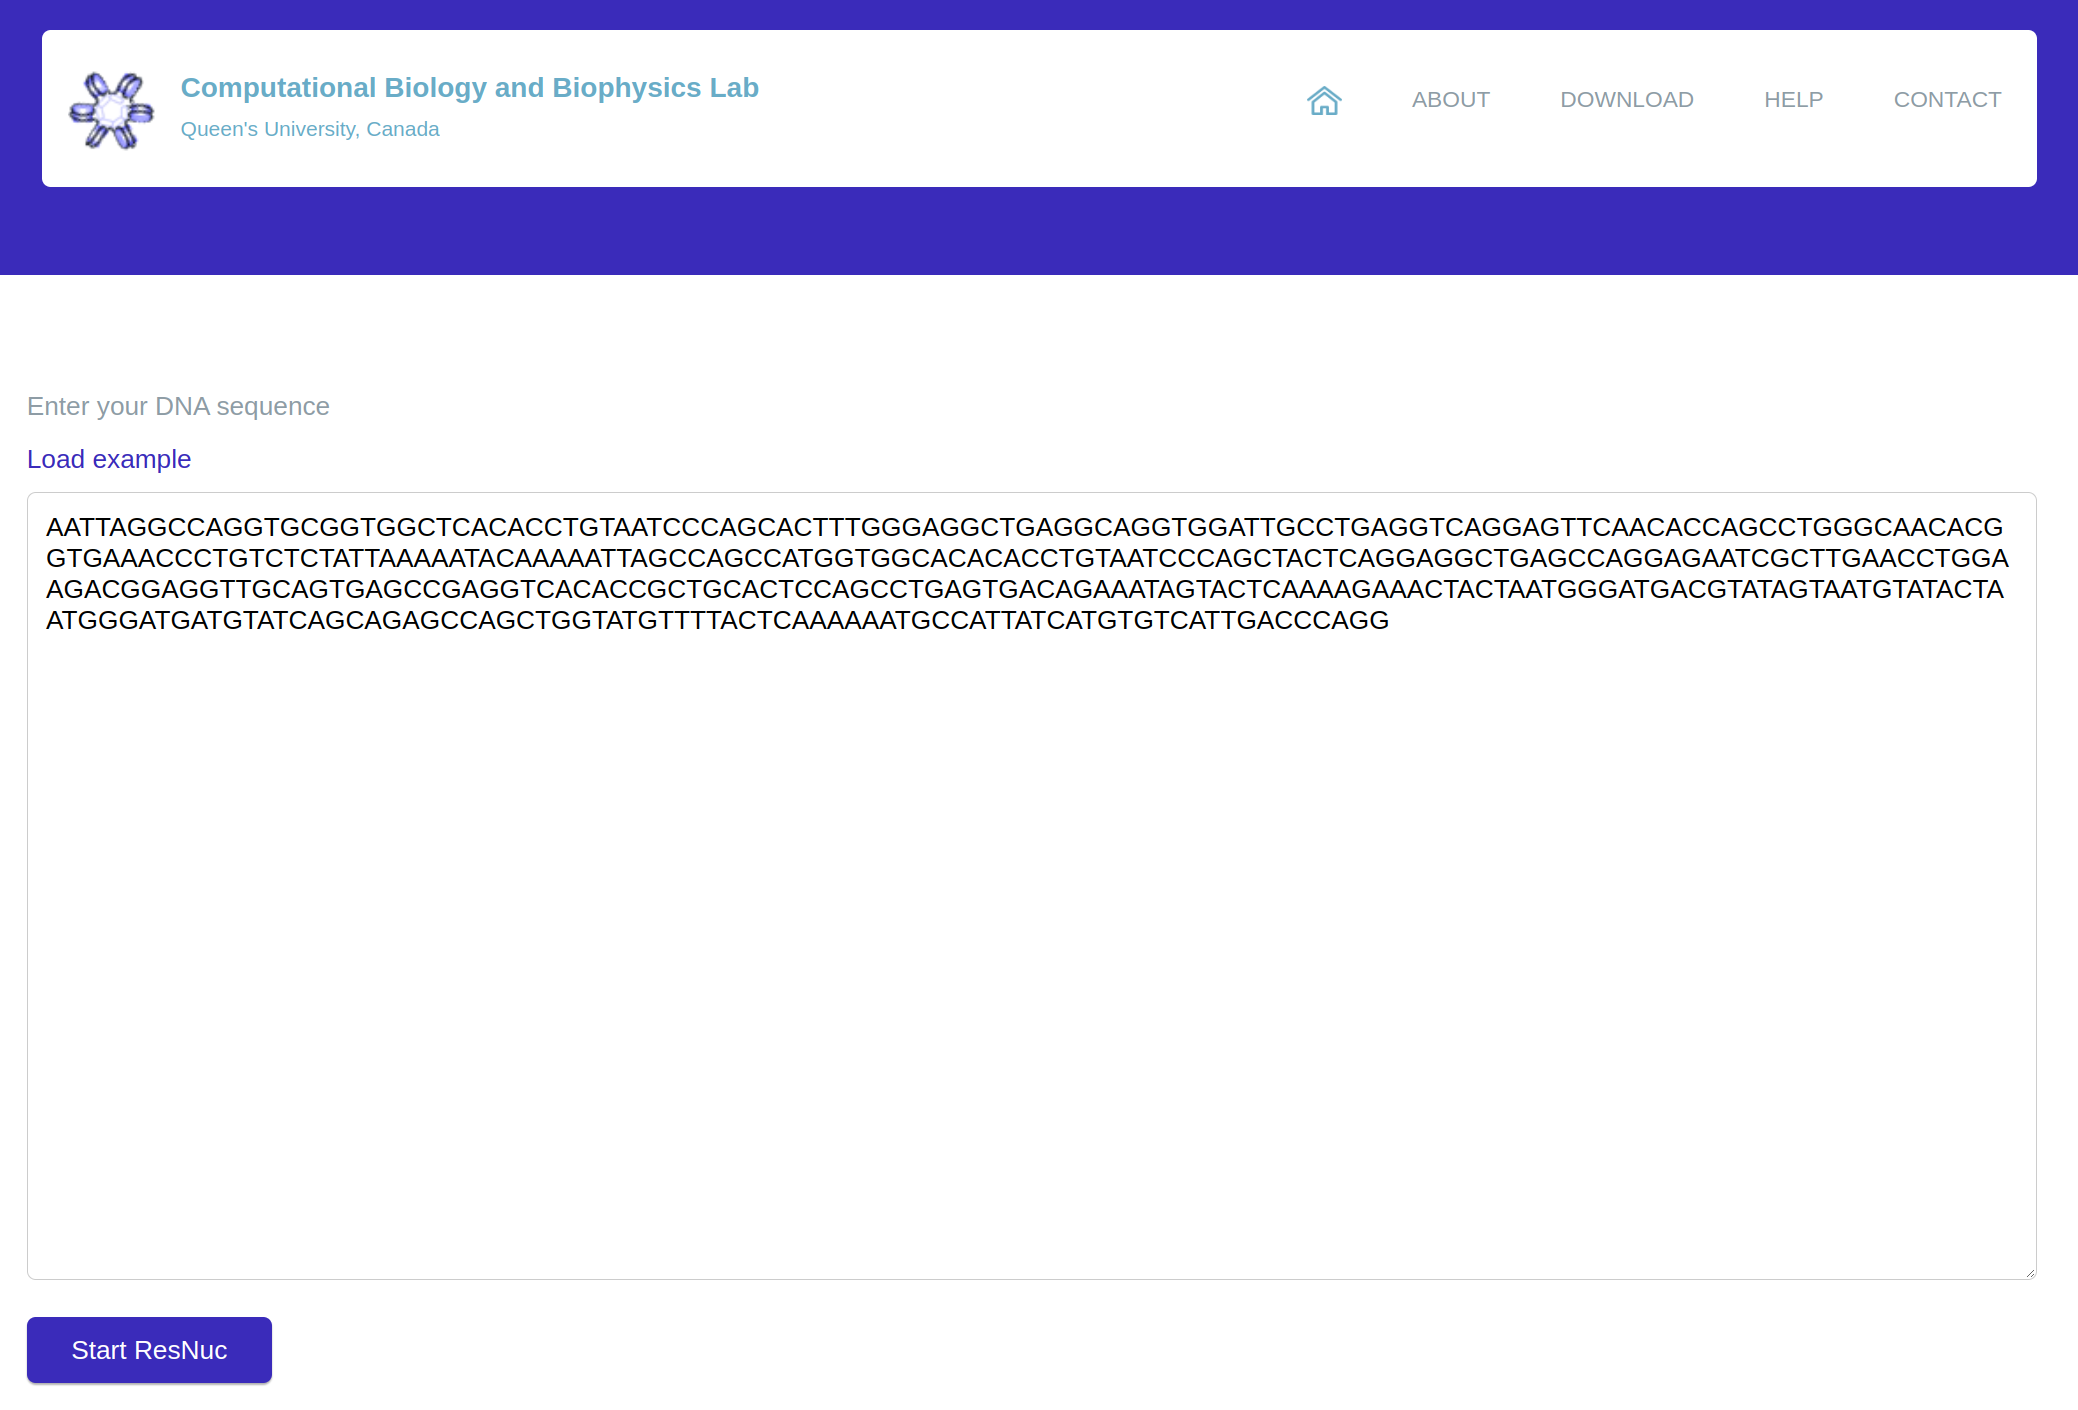
Figure 4: The MNPP section of ResNuc’s web-based platform
After calling ResNuc, the
prediction page appears, which shows the predicted positioning scores (Figure 5). At the bottom section of
the page, there is a download button, by which users can get a copy of the predicted results as a
text-format file and use it for further analysis. This file includes 3 slices for every record: (i) the row
number, (ii) the position’s number/the DNA fragment’s name, and (ii) the positioning score.
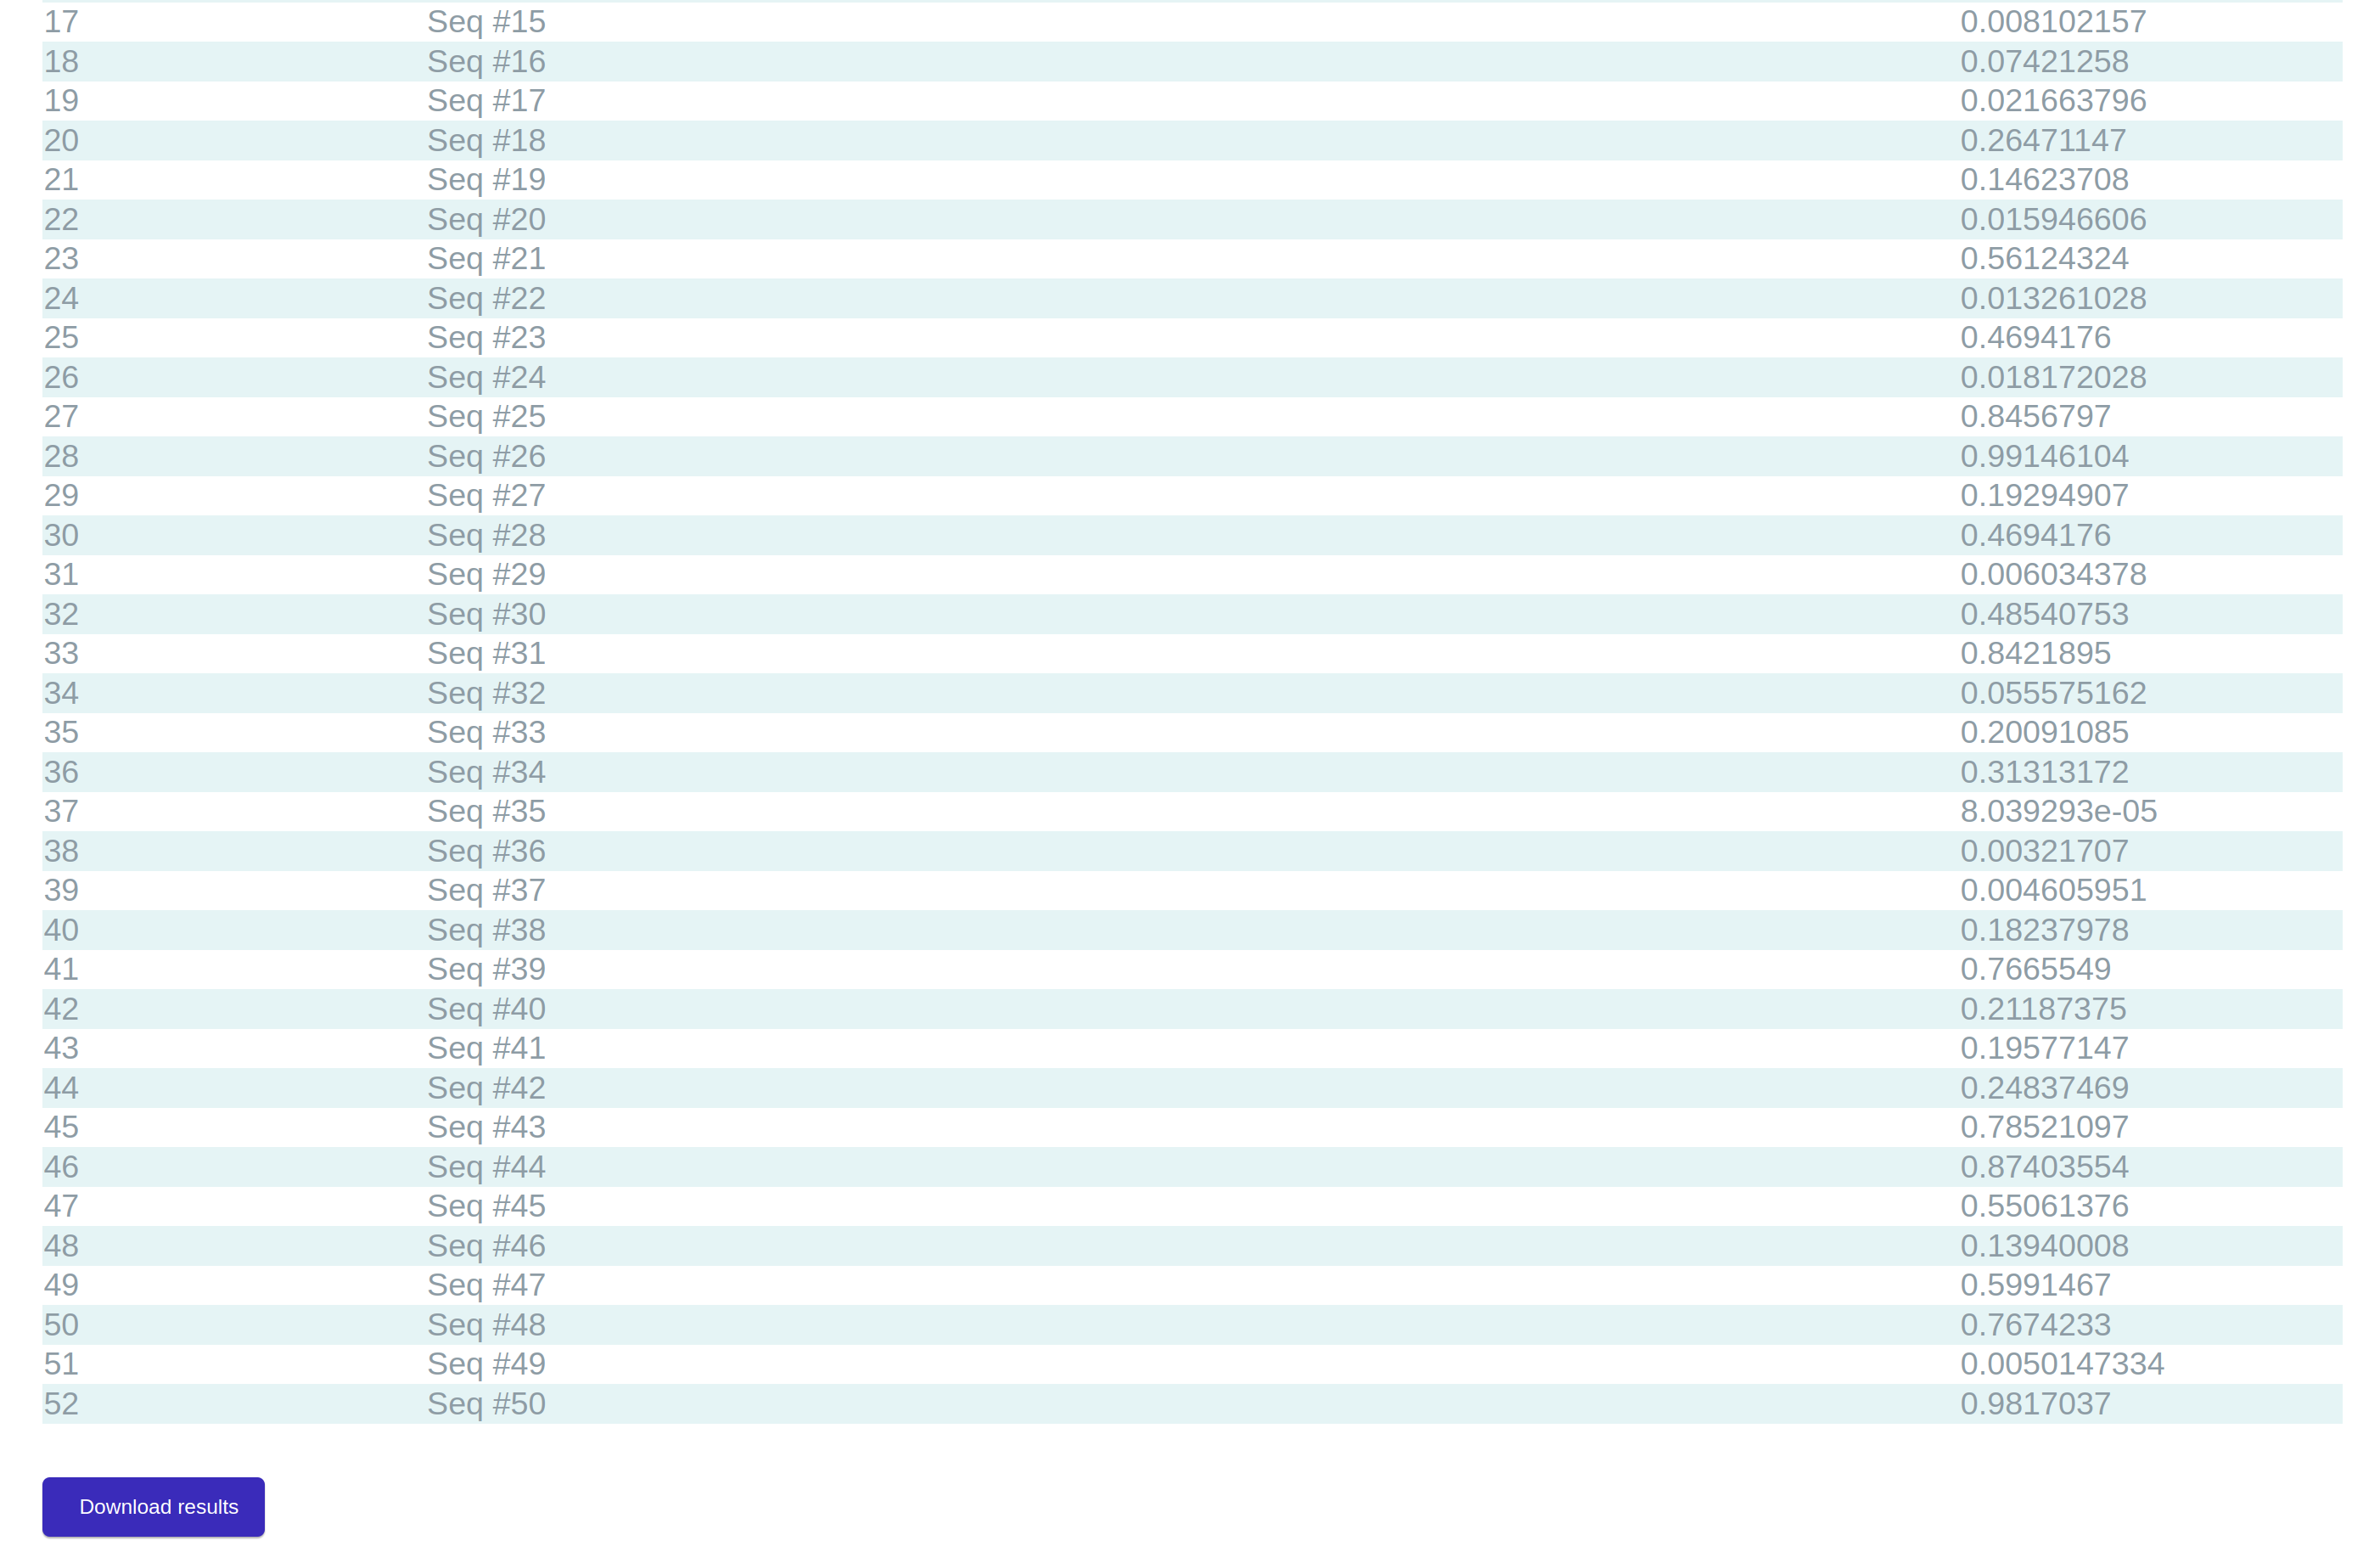
Figure 5: An instance of the results section


